The circle graph shows the results of the student council presidential election. The complete circular area represents 100%
of the votes.
-Student Council President 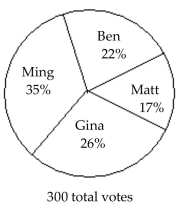 The circle graph shows what percent of the vote each person received. What percent of the votes did Matt and Ben receive together?
A) 22%
B) 39%
C) 61%
D) 17%
Correct Answer:
Verified
Q35: The double-line graph shows temperature highs and
Q37: The line graph shows the recorded hourly
Q38: The line graph shows the recorded hourly
Q39: The double-line graph shows temperature highs and
Q41: Fill in the table. Round to
Q42: Find the mean. If necessary, round to
Q43: The circle graph summarizes the results
Q44: Find the mean. If necessary, round to
Q45: The circle graph shows the results of
Q193: Use the graph to solve the problem.
-During
Unlock this Answer For Free Now!
View this answer and more for free by performing one of the following actions

Scan the QR code to install the App and get 2 free unlocks

Unlock quizzes for free by uploading documents