The circle graph summarizes the results of a survey of the favorite movie category chosen by a group of adults. 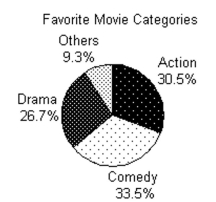
-2400 adults answer the survey. Find the ratio of number of respondents who favor others to those who favor comedies. Write the ratio as a
Fraction with integers in the numerator and denominator.
A)
B)
C)
D)
Correct Answer:
Verified
Q38: The line graph shows the recorded hourly
Q39: The double-line graph shows temperature highs and
Q40: The circle graph shows the results of
Q41: Fill in the table. Round to
Q42: Find the mean. If necessary, round to
Q44: Find the mean. If necessary, round to
Q45: The circle graph shows the results of
Q46: The circle graph summarizes the results of
Q47: Find the mean. If necessary, round to
Q48: Find the median. If necessary, round to
Unlock this Answer For Free Now!
View this answer and more for free by performing one of the following actions

Scan the QR code to install the App and get 2 free unlocks

Unlock quizzes for free by uploading documents