The circle graph summarizes the results of a survey of the favorite movie category chosen by a group of adults. 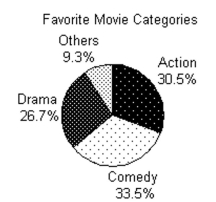
-1800 adults answer the survey. How many of the survey respondents said that they favor comedies? Round to the nearest whole.
A) 3350 respondents
B) 481 respondents
C) 603 respondents
D) 167 respondents
Correct Answer:
Verified
Q41: Fill in the table. Round to
Q42: Find the mean. If necessary, round to
Q43: The circle graph summarizes the results
Q44: Find the mean. If necessary, round to
Q45: The circle graph shows the results of
Q47: Find the mean. If necessary, round to
Q48: Find the median. If necessary, round to
Q49: Find the mean. If necessary, round to
Q50: Find the mean. If necessary, round to
Q51: Find the median. If necessary, round to
Unlock this Answer For Free Now!
View this answer and more for free by performing one of the following actions

Scan the QR code to install the App and get 2 free unlocks

Unlock quizzes for free by uploading documents