Consider the figure below. An increase in uncertainty would lead to a movement from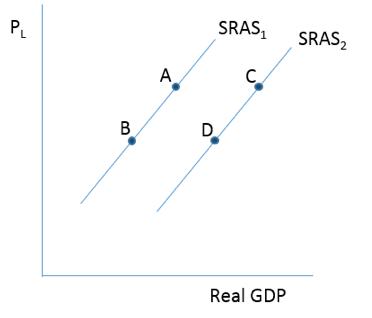
A) A to B.
B) D to C.
C) A to C.
D) D to B.
Correct Answer:
Verified
Q20: Which of these would cause a decrease
Q21: Several factors can cause the SRAS curve
Q22: Consider the figure below . A decrease
Q23: When resource markets are efficient, recessionary gaps
Q24: Consider the figure below . If the
Q26: What is the logic behind the spending
Q27: The rational expectations approach postulates what two
Q28: What is the term for using all
Q29: Consider the figure below. The situation in
Q30: When the actual level of output is
Unlock this Answer For Free Now!
View this answer and more for free by performing one of the following actions

Scan the QR code to install the App and get 2 free unlocks

Unlock quizzes for free by uploading documents