Consider the figure below. The situation in Noprovia is represented by SRAS 1 and AD 1 . The long-run equilibrium real GDP and price level for the economy is represented by point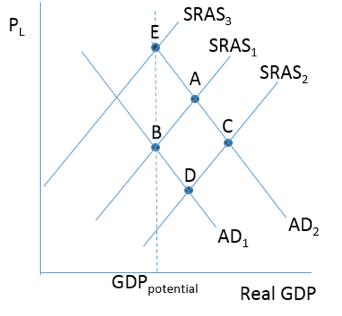
A) E.
B) B.
C) A.
D) D.
Correct Answer:
Verified
Q24: Consider the figure below . If the
Q25: Consider the figure below. An increase in
Q26: What is the logic behind the spending
Q27: The rational expectations approach postulates what two
Q28: What is the term for using all
Q30: When the actual level of output is
Q31: Explain how an economy might close a
Q33: Real Business Cycle models, or RBCs, assume
Q34: Consider the figure below representing the current
Q203: Why does the aggregate demand curve slope
Unlock this Answer For Free Now!
View this answer and more for free by performing one of the following actions

Scan the QR code to install the App and get 2 free unlocks

Unlock quizzes for free by uploading documents