Use the figure below to answer the following question(s) . Figure 10-15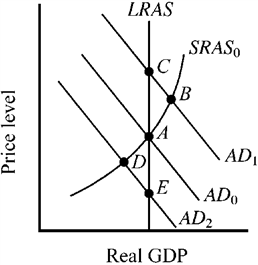 The economy's short-run (SRAS ) and long-run (LRAS) aggregate supply curves are shown in Figure 10-15, along with three alternative aggregate demand curves and the accompanying equilibrium points. At which point will resource prices naturally tend to increase?
A) A
B) B
C) C
D) D
Correct Answer:
Verified
Q165: Use the figure below to answer the
Q166: Use the figure below to answer the
Q167: Figure 10-18 Q168: Figure 10-18 Q169: Use the figure below to answer the Q171: Which of the following will most likely Q172: Use the figure below to answer the Q173: Which of the following will most likely Q174: Figure 10-18 Q175: Use the figure below to answer the Unlock this Answer For Free Now! View this answer and more for free by performing one of the following actions Scan the QR code to install the App and get 2 free unlocks Unlock quizzes for free by uploading documents![]()
![]()
![]()

