Figure 10-18 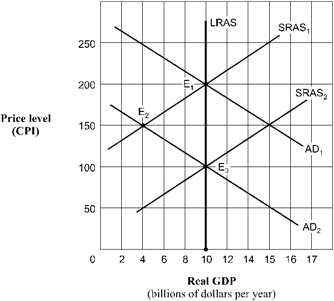 Beginning from long-run equilibrium at point E1 in Figure 10-18, the aggregate demand curve shifts to AD2. The real GDP and price level (CPI) in short-run equilibrium will be
A) $10 billion and 200.
B) $10 billion and 150.
C) $10 billion and 100.
D) $4 billion and 150.
Correct Answer:
Verified
Q169: Use the figure below to answer the
Q170: Use the figure below to answer the
Q171: Which of the following will most likely
Q172: Use the figure below to answer the
Q173: Which of the following will most likely
Q175: Use the figure below to answer the
Q176: Which of the following would be most
Unlock this Answer For Free Now!
View this answer and more for free by performing one of the following actions

Scan the QR code to install the App and get 2 free unlocks

Unlock quizzes for free by uploading documents