Figure 10-18 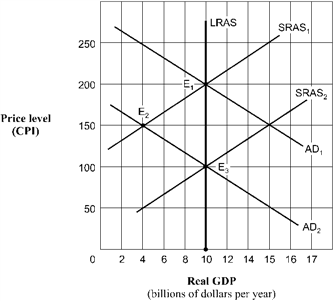 Beginning in Figure 10-18 from long-run equilibrium at point E1, the aggregate demand curve shifts to AD2. The economy's path to a new long-run equilibrium is represented by a movement from
A) E3 to E1 to E2.
B) E1 to E3 to E2.
C) E2 to E1 to E2.
D) E1 to E2 to E3.
Correct Answer:
Verified
Q172: Use the figure below to answer the
Q173: Which of the following will most likely
Q174: Figure 10-18 Q175: Use the figure below to answer the Q176: Which of the following would be most Q178: Figure 10-18 Q179: Use the figure below to answer the Unlock this Answer For Free Now! View this answer and more for free by performing one of the following actions Scan the QR code to install the App and get 2 free unlocks Unlock quizzes for free by uploading documents![]()
![]()

