Figure 10-18 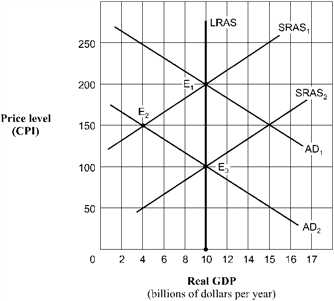 As shown in Figure 10-18, and assuming the aggregate demand curve shifts from AD1 to AD2, the full-employment level of real GDP is
A) $10 billion.
B) $4 billion.
C) $100 billion.
D) unable to be determined.
Correct Answer:
Verified
Q175: Use the figure below to answer the
Q176: Which of the following would be most
Q177: Figure 10-18 Q178: Figure 10-18 Q179: Use the figure below to answer the Q181: Suppose there is an unexpected increase in Q182: Which of the following will most likely Q183: An increase in the long-run aggregate supply Q184: How does the self-correcting mechanism act to Q185: From mid-year 2006 to year-end 2008, housing![]()
![]()
Unlock this Answer For Free Now!
View this answer and more for free by performing one of the following actions

Scan the QR code to install the App and get 2 free unlocks

Unlock quizzes for free by uploading documents