The table below shows the velocities, in feet per second, of a ball that is thrown horizontally from the top of a 50 foot building and the distances, in feet, that it lands from the base of the building. Compute the linear regression equation for these data. 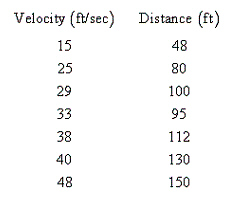
A) 
B) 
C) 
D) 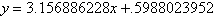
E) 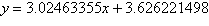
Correct Answer:
Verified
Q78: Use the graph of g, shown below,
Q79: Evaluate Q80: Find the difference quotient of the function Q81: Determine for which scatter diagram, A or Q82: Find the linear regression equation for the Q83: The table below shows the velocities, in Q84: The fuel efficiency, in miles per gallon, Q85: The table below gives the wingspan, in Q86: The fuel efficiency, in miles per gallon, Q87: Find a quadratic regression model for the![]()
Unlock this Answer For Free Now!
View this answer and more for free by performing one of the following actions

Scan the QR code to install the App and get 2 free unlocks

Unlock quizzes for free by uploading documents