The following table shows the approximate value V of one Euro in U.S, dollars from its introduction in January 2000 to January 2004. (  represents January, 2000.)
 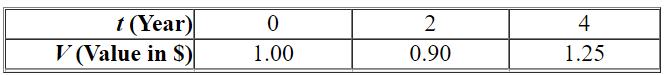 Which model would best fit the given data? ( A , a , b , c , k , l , and m are constants.)
A) Exponential: 
B) Logarithmic: 
C) Cubic: 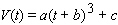
D) Quadratic: 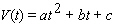
E) Linear: 
Correct Answer:
Verified
Q50: Sketch the straight line with the equation.
Q51: Find the equation of the given linear
Q52: Calculate the slope of the straight line
Q53: A table of values for a linear
Q54: Sketch the straight line of the following
Q56: The following table shows the approximate average
Q57: A table of values for a linear
Q58: Calculate the slope of the straight line
Q59: Find the linear equation that is the
Q60: Annual federal spending on Medicare increased more
Unlock this Answer For Free Now!
View this answer and more for free by performing one of the following actions

Scan the QR code to install the App and get 2 free unlocks

Unlock quizzes for free by uploading documents