The following table shows the approximate average household income in the U.S. in 1995, 2002, and 2003. (  represents 1995.)
 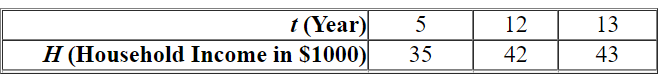 Which of the following kinds of models would best fit the given data? ( A , a , b , c , and m are constants.)
A) Quadratic: 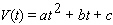
B) Logarithmic: 
C) Power: 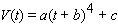
D) Linear: 
E) Exponential: 
Correct Answer:
Verified
Q51: Find the equation of the given linear
Q52: Calculate the slope of the straight line
Q53: A table of values for a linear
Q54: Sketch the straight line of the following
Q55: The following table shows the approximate value
Q57: A table of values for a linear
Q58: Calculate the slope of the straight line
Q59: Find the linear equation that is the
Q60: Annual federal spending on Medicare increased more
Q61: Find the linear equation that is the
Unlock this Answer For Free Now!
View this answer and more for free by performing one of the following actions

Scan the QR code to install the App and get 2 free unlocks

Unlock quizzes for free by uploading documents