The graph shows the actual percentage of U.S. households with a computer as a function of household income (the data points)and a logistic model of these data (the curve). The logistic model is 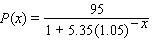 where
where  is the household income in thousands of dollars. According to the model, what percentage of extremely wealthy households had computers?
 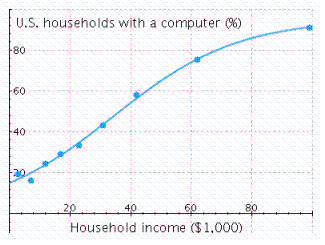 P = __________%
Correct Answer:
Verified
Q77: The graph shows the actual percentage of
Q78: Choose the logistic function that best approximates
Q79: Convert the exponential function to the form
Q80: Find the logistic function Q81: The following graph shows the actual percentage Q83: The chart shows the number of research Q84: Choose the logistic function that best approximates Q85: The chart shows the number of research Q86: Last year's epidemic of Martian flu began Q87: In Russia the average consumer drank two![]()
Unlock this Answer For Free Now!
View this answer and more for free by performing one of the following actions

Scan the QR code to install the App and get 2 free unlocks

Unlock quizzes for free by uploading documents