The chart shows the number of research articles in the prominent journal Physics Review that were written by researchers in Europe during 1983-2003 (  represents 1983).
 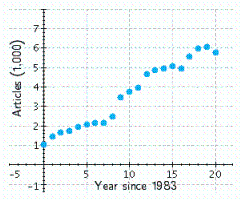 Which of the following logistic functions best models the data? (
  is the number of years since 1983.)Try to determine the correct model without actually computing data points.
(a) 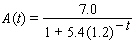
(B) 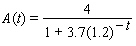
(c) 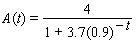
(D) 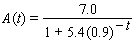 __________ According to the model you selected, at what percentage was the number of articles growing around 1984? __________%
Correct Answer:
Verified
Q78: Choose the logistic function that best approximates
Q79: Convert the exponential function to the form
Q80: Find the logistic function Q81: The following graph shows the actual percentage Q82: The graph shows the actual percentage of Q84: Choose the logistic function that best approximates Q85: The chart shows the number of research Q86: Last year's epidemic of Martian flu began Q87: In Russia the average consumer drank two Q88: There are currently 1,000 cases of Venusian![]()
Unlock this Answer For Free Now!
View this answer and more for free by performing one of the following actions

Scan the QR code to install the App and get 2 free unlocks

Unlock quizzes for free by uploading documents