A population of rabbits was tracked over a 55-day period. The data is shown in the following graph. How did the population of rabbits change between day 3 and day 20? 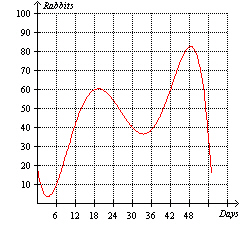
A) The population of rabbits increased from approximately 5 rabbits to 83 rabbits.
B) The population of rabbits decreased from approximately 83 rabbits to 5 rabbits.
C) The population of rabbits increased from approximately 5 rabbits to 61 rabbits.
D) The population of rabbits was constant during this time period.
E) The population of rabbits decreased from approximately 61 rabbits to 5 rabbits.
Correct Answer:
Verified
Q45: Given the table below find the net
Q46: Use the following graph to create an
Q47: Find the domain of Q48: A ball is thrown straight upward from Q49: The cost of college tuition for 12 Q51: A membership to a local fitness club Q52: A population of rabbits was tracked over Q53: Given the table below find the net Q54: The verbal description below can be represented Q55: Let f(x) = 3 x ![]()

Unlock this Answer For Free Now!
View this answer and more for free by performing one of the following actions

Scan the QR code to install the App and get 2 free unlocks

Unlock quizzes for free by uploading documents