A population of rabbits was tracked over a 55-day period. The data is shown in the following graph. What was the maximum number of rabbits during this time period? 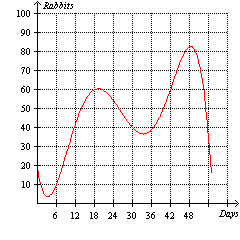
A) 61
B) 49
C) 38
D) 15
E) 83
Correct Answer:
Verified
Q47: Find the domain of Q48: A ball is thrown straight upward from Q49: The cost of college tuition for 12 Q50: A population of rabbits was tracked over Q51: A membership to a local fitness club Q53: Given the table below find the net Q54: The verbal description below can be represented Q55: Let f(x) = 3 x Q56: Consider the function f(x) = 4 x Q57: A membership to a local fitness club![]()

Unlock this Answer For Free Now!
View this answer and more for free by performing one of the following actions

Scan the QR code to install the App and get 2 free unlocks

Unlock quizzes for free by uploading documents