You are preparing data from a series of weight loss studies for display. The data collected during the study is as follows: If you want to allow. the reader to compare the results of Group A with those of Group B on one graphic display, your best choice would be to construct a 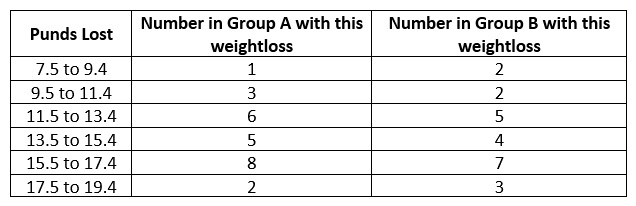
A) bar chart.
B) line graph.
C) histogram.
D) frequency polygon.
Correct Answer:
Verified
Q1174: Joseph Woodley has been on a third
Q1175: What was the gross (hospital) death rate
Q1176: Styles Hospital has 200 beds and 20
Q1177: The statistics reported for a 300-bed hospital
Q1178: What was the net death rate at
Q1180: During the month of September, Superior Health
Q1181: The data display below is a
Q1182: Looking at the data represented in the
Q1183: Twelve new cases of a certain disease
Q1184: You are trying to improve communications with
Unlock this Answer For Free Now!
View this answer and more for free by performing one of the following actions

Scan the QR code to install the App and get 2 free unlocks

Unlock quizzes for free by uploading documents