Looking at the data represented in the scatter diagram below, you would conclude that there is 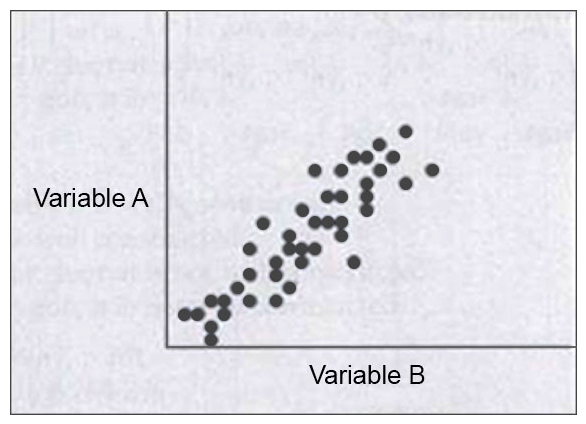
A) no correlation between Variable A and Variable B
B) a positive correlation between Variable A and Variable B
C) a negative correlation between Variable A and variable B
D) a cause and effect relationship between Variable A and Variable B
Correct Answer:
Verified
Q1177: The statistics reported for a 300-bed hospital
Q1178: What was the net death rate at
Q1179: You are preparing data from a series
Q1180: During the month of September, Superior Health
Q1181: The data display below is a
Q1183: Twelve new cases of a certain disease
Q1184: You are trying to improve communications with
Q1185: The chart above shows a normal distribution.
Q1186: Harry H. Potter was admitted to your
Q1187: The graph below can best be described
Unlock this Answer For Free Now!
View this answer and more for free by performing one of the following actions

Scan the QR code to install the App and get 2 free unlocks

Unlock quizzes for free by uploading documents