The chart above shows a normal distribution. What percentage of the cases fall within the two lines showing the standard distribution between -1 and +1 on either side of the mean? 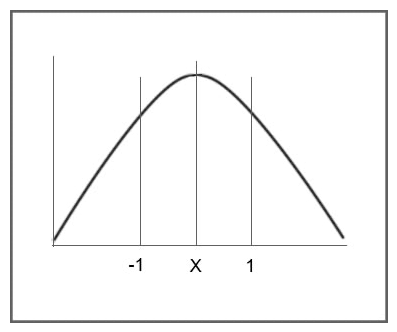
A) 68%
B) 75%
C) 95%
D) 99%
Correct Answer:
Verified
Q1180: During the month of September, Superior Health
Q1181: The data display below is a
Q1182: Looking at the data represented in the
Q1183: Twelve new cases of a certain disease
Q1184: You are trying to improve communications with
Q1186: Harry H. Potter was admitted to your
Q1187: The graph below can best be described
Q1188: What is the biggest problem with the
Q1189: What conclusion can you make from the
Q1190: The data display below is a
Unlock this Answer For Free Now!
View this answer and more for free by performing one of the following actions

Scan the QR code to install the App and get 2 free unlocks

Unlock quizzes for free by uploading documents