The data display below is a 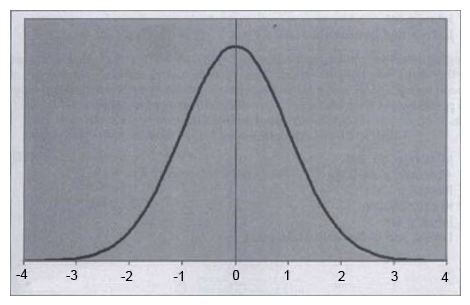
A) normal distribution or curve.
B) positive skewed curve.
C) negative skewed curve.
D) heterogenous curve.
E) none of the above.
Correct Answer:
Verified
Q1185: The chart above shows a normal distribution.
Q1186: Harry H. Potter was admitted to your
Q1187: The graph below can best be described
Q1188: What is the biggest problem with the
Q1189: What conclusion can you make from the
Q1191: A transcription supervisor collected the data displayed
Q1192: Look at the graph below. It is
Q1193: The data displayed in the histogram below
Q1194: You want to construct a data display
Q1195: The primary difference between an experimental (randomized)
Unlock this Answer For Free Now!
View this answer and more for free by performing one of the following actions

Scan the QR code to install the App and get 2 free unlocks

Unlock quizzes for free by uploading documents