The data displayed in the histogram below could best be described as 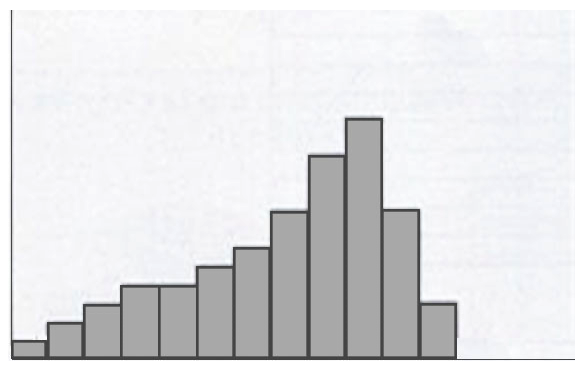
A) negatively skewed.
B) positively skewed.
C) evenly distributed
D) normally distributed
Correct Answer:
Verified
Q1188: What is the biggest problem with the
Q1189: What conclusion can you make from the
Q1190: The data display below is a
Q1191: A transcription supervisor collected the data displayed
Q1192: Look at the graph below. It is
Q1194: You want to construct a data display
Q1195: The primary difference between an experimental (randomized)
Q1196: The ability to obtain the same results
Q1197: The time period of a facility's Institutional
Q1198: Look again at the graph you used
Unlock this Answer For Free Now!
View this answer and more for free by performing one of the following actions

Scan the QR code to install the App and get 2 free unlocks

Unlock quizzes for free by uploading documents