Look again at the graph you used for the last question. From this graph, you can assume that more people 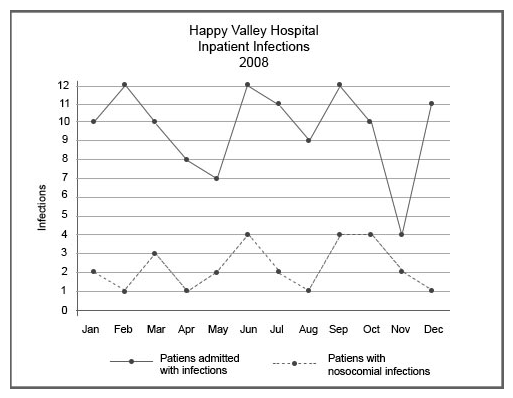
A) were admitted to the facility with infections than without infections.
B) were admitted to the facility with infections than is typical for U.S. hospitals.
C) were admitted to the facility with infections than acquired infections in the hospital.
D) acquired infections in the hospital than were admitted with infections.
Correct Answer:
Verified
Q1193: The data displayed in the histogram below
Q1194: You want to construct a data display
Q1195: The primary difference between an experimental (randomized)
Q1196: The ability to obtain the same results
Q1197: The time period of a facility's Institutional
Q1199: The total number of infections at Happy
Q1200: You have been conducting productivity studies on
Q1201: It takes twice as long to perform
Q1202: Your facility conducted a study of patient
Q1203: Your administrator is concerned about the snuff
Unlock this Answer For Free Now!
View this answer and more for free by performing one of the following actions

Scan the QR code to install the App and get 2 free unlocks

Unlock quizzes for free by uploading documents