What conclusion can you make from the pie graph below? 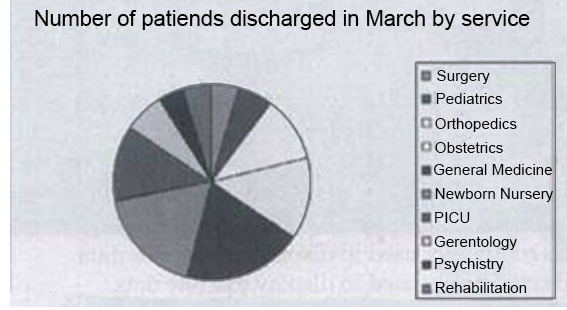
A) A pie graph should not be used because there are too many categories for effective display.
B) A pie graph should not be used, because the data are representational instead of quantitative
C) A pie graph should not be used, because the data are qualitative instead of quantitative.
D) A pie graph is a good choice and is often used to display this kind of data.
Correct Answer:
Verified
Q1184: You are trying to improve communications with
Q1185: The chart above shows a normal distribution.
Q1186: Harry H. Potter was admitted to your
Q1187: The graph below can best be described
Q1188: What is the biggest problem with the
Q1190: The data display below is a
Q1191: A transcription supervisor collected the data displayed
Q1192: Look at the graph below. It is
Q1193: The data displayed in the histogram below
Q1194: You want to construct a data display
Unlock this Answer For Free Now!
View this answer and more for free by performing one of the following actions

Scan the QR code to install the App and get 2 free unlocks

Unlock quizzes for free by uploading documents