The graph below can best be described as 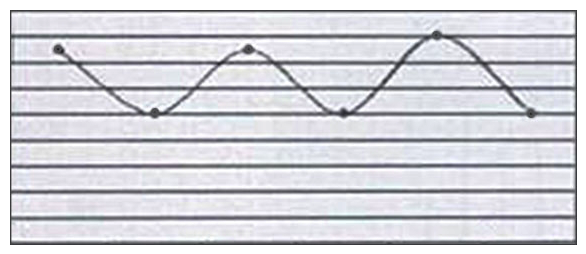
A) sequential.
B) multimodal.
C) substitutional
D) erratic.
Correct Answer:
Verified
Q1182: Looking at the data represented in the
Q1183: Twelve new cases of a certain disease
Q1184: You are trying to improve communications with
Q1185: The chart above shows a normal distribution.
Q1186: Harry H. Potter was admitted to your
Q1188: What is the biggest problem with the
Q1189: What conclusion can you make from the
Q1190: The data display below is a
Q1191: A transcription supervisor collected the data displayed
Q1192: Look at the graph below. It is
Unlock this Answer For Free Now!
View this answer and more for free by performing one of the following actions

Scan the QR code to install the App and get 2 free unlocks

Unlock quizzes for free by uploading documents