Using the information in the table below, calculate the average percentage of patients for the entire year who waited longer than an acceptable amount of waiting time. (The sample size for each month's data is 100.) 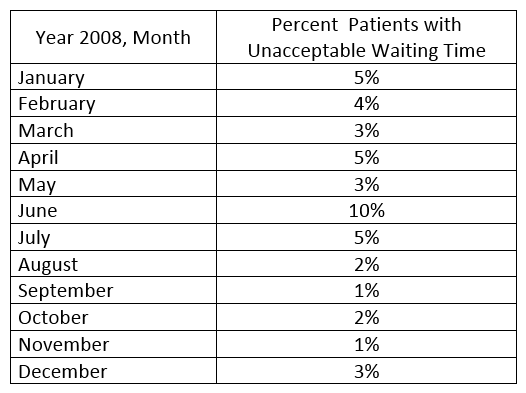
A) 3.1%
B) 3.6%
C) 3.7%
D) 4.0%
Correct Answer:
Verified
Q1287: The manager of a Health Information Department
Q1288: Which department will most likely be responsible
Q1289: Which data bank is a result of
Q1290: What is the best tool for differentiating
Q1291: The outpatient coding staff has been working
Q1293: You are the Quality Coordinator for the
Q1294: All of the following are among Joint
Q1295: An accreditation agency counterpart to the Joint
Q1296: Strong lateral relationships within a facility are
Q1297: All of the following data would appear
Unlock this Answer For Free Now!
View this answer and more for free by performing one of the following actions

Scan the QR code to install the App and get 2 free unlocks

Unlock quizzes for free by uploading documents