The figure given below shows the consumption function of a household.?Figure 9.2
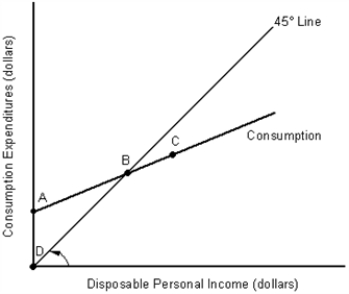
-In Figure 9.2, an increase in autonomous consumption would be illustrated by:
A) a movement from point A to point D.
B) a movement from point A to point B.
C) an upward shift of the consumption function.
D) a downward shift of the consumption function.
E) a movement from point C to point B.
Correct Answer:
Verified
Q25: The figure given below represents the consumption
Q29: The figure given below shows the consumption
Q32: The sum of the MPC and the
Q33: The figure given below represents the consumption
Q35: The figure given below represents the consumption
Q35: The figure given below shows the consumption
Q36: The figure given below represents the consumption
Q37: As disposable income rises:
A) consumption falls, but
Q39: The figure given below shows the consumption
Q39: The table given below reports the consumption
Unlock this Answer For Free Now!
View this answer and more for free by performing one of the following actions

Scan the QR code to install the App and get 2 free unlocks

Unlock quizzes for free by uploading documents