The figure given below represents the consumption function of a country.?Figure 9.3
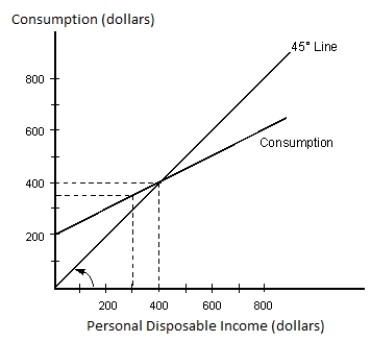
-Refer to Figure 9.3. If the marginal propensity to consume is equal to 0.3, then:
A) autonomous consumption would decrease.
B) the total amount of dissaving would increase.
C) consumption spending would equal disposable income at an income level greater than $400.
D) consumption spending would equal disposable income at an income level less than $400.
E) consumption spending would equal disposable income at the income level of $400.
Correct Answer:
Verified
Q21: The consumption function becomes flatter if:
A)the average
Q25: The figure given below represents the consumption
Q29: The figure given below shows the consumption
Q32: The sum of the MPC and the
Q34: The figure given below shows the consumption
Q35: The figure given below represents the consumption
Q35: The figure given below shows the consumption
Q36: The figure given below represents the consumption
Q37: As disposable income rises:
A) consumption falls, but
Q39: The figure given below shows the consumption
Unlock this Answer For Free Now!
View this answer and more for free by performing one of the following actions

Scan the QR code to install the App and get 2 free unlocks

Unlock quizzes for free by uploading documents