The 2011 Canadian Census at School project collected data on school-age children. The following scatterplot below the mean wrist circumference of boys according to age:
The form of the relationship in this scatterplot might best be described as
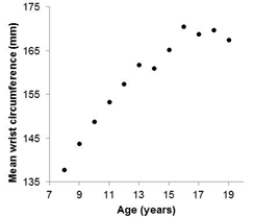
A) Negative.
B) Curved.
C) Linear.
D) Clustered.
Correct Answer:
Verified
Q9: The volume of oxygen consumed (in liters
Q10: Bird species from temperate regions must cope
Q11: Bird species from temperate regions must cope
Q12: Bird species from temperate regions must cope
Q13: Bird species from temperate regions must cope
Q15: Consider the following scatterplot:
What is the best
Q16: Consider the following scatterplot of the weight
Q17: Consider the following scatterplot of the infected
Q18: Consider the following scatterplot of two variables
Q19: The data in the following scatterplot are
Unlock this Answer For Free Now!
View this answer and more for free by performing one of the following actions

Scan the QR code to install the App and get 2 free unlocks

Unlock quizzes for free by uploading documents