Consider the following scatterplot:
What is the best description of the form of the relationship represented in the plot?
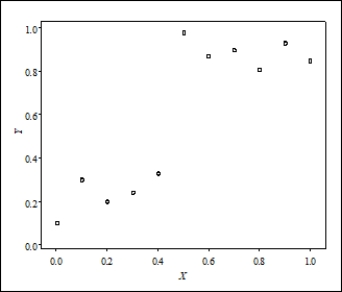
A) Strongly curved
B) Negative association
C) Clustered
Correct Answer:
Verified
Q10: Bird species from temperate regions must cope
Q11: Bird species from temperate regions must cope
Q12: Bird species from temperate regions must cope
Q13: Bird species from temperate regions must cope
Q14: The 2011 Canadian Census at School project
Q16: Consider the following scatterplot of the weight
Q17: Consider the following scatterplot of the infected
Q18: Consider the following scatterplot of two variables
Q19: The data in the following scatterplot are
Q20: Do creative people make better teachers?
Unlock this Answer For Free Now!
View this answer and more for free by performing one of the following actions

Scan the QR code to install the App and get 2 free unlocks

Unlock quizzes for free by uploading documents