Do creative people make better teachers? Ten teachers at a large university were given a creativity test (scores range from 0 to 20, with higher scores indicating greater creativity) and were evaluated regarding teaching performance by students and peers (a score of 100 indicates an average performance, and larger scores indicate better performance) . The creativity scores and teaching performance scores are given below.
?
?
Which of the following scatterplots would appropriately display these data given the research question?
A) 
B) 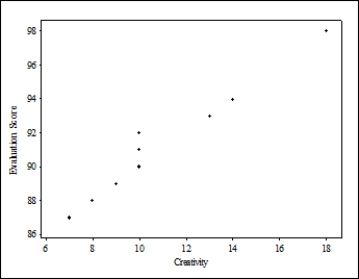
C) 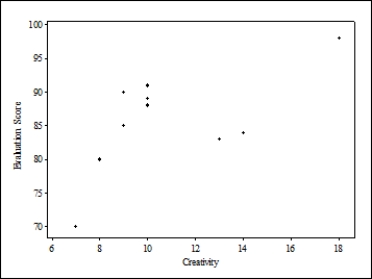
D) 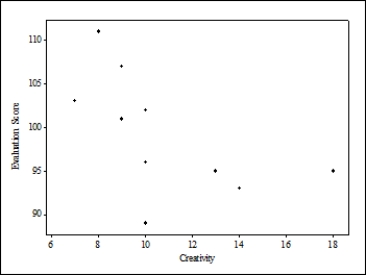
Correct Answer:
Verified
Q16: Consider the following scatterplot of the weight
Q17: Consider the following scatterplot of the infected
Q18: Consider the following scatterplot of two variables
Q19: The data in the following scatterplot are
Q20: Do creative people make better teachers?
Q22: Do creative people make better teachers?
Q23: Do creative people make better teachers?
Q24: The protease activity found in walnuts
Q25: The protease activity found in walnuts
Q26: When water flows across farm land,
Unlock this Answer For Free Now!
View this answer and more for free by performing one of the following actions

Scan the QR code to install the App and get 2 free unlocks

Unlock quizzes for free by uploading documents