The protease activity found in walnuts preserved in buffers of various pHs is listed in the following table:
?
?
Which of the following scatterplots is a correct representation of the data?
A) 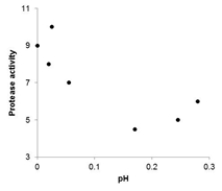
B) 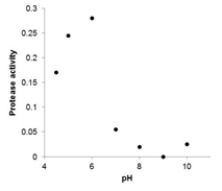
C) 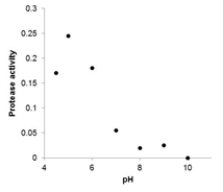
D) 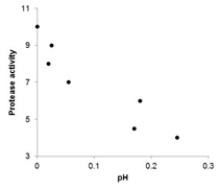
Correct Answer:
Verified
Q19: The data in the following scatterplot are
Q20: Do creative people make better teachers?
Q21: Do creative people make better teachers?
Q22: Do creative people make better teachers?
Q23: Do creative people make better teachers?
Q25: The protease activity found in walnuts
Q26: When water flows across farm land,
Q27: When water flows across farm land,
Q28: Which of the following statements about correlation
Q29: Which of the following statements about the
Unlock this Answer For Free Now!
View this answer and more for free by performing one of the following actions

Scan the QR code to install the App and get 2 free unlocks

Unlock quizzes for free by uploading documents