Five strains of the Staphylococcus aureus bacteria were grown at 35 degrees Celsius for either 24 hours or 48 hours. Here are the resulting bacterial counts for each condition:
Which of the following scatterplots is a correct representation of these data?
A) 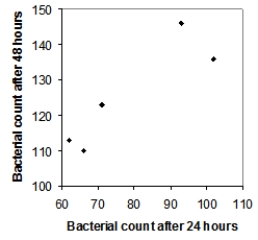
B) 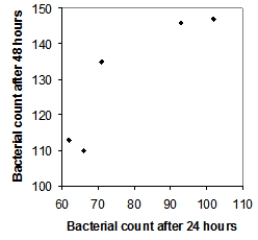
C) 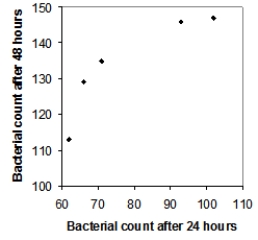
D) 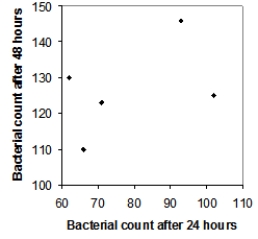
Correct Answer:
Verified
Q32: Tail-feather length in birds is sometimes
Q33: Tail-feather length in birds is sometimes
Q34: Tail-feather length in birds is sometimes
Q35: Tail-feather length in birds is sometimes
Q36: Tail-feather length in birds is sometimes
Q38: Five strains of the Staphylococcus aureus
Q39: Five strains of the Staphylococcus aureus
Q40: Five strains of the Staphylococcus aureus
Q41: Five strains of the Staphylococcus aureus
Q42: For which of the following scatterplots would
Unlock this Answer For Free Now!
View this answer and more for free by performing one of the following actions

Scan the QR code to install the App and get 2 free unlocks

Unlock quizzes for free by uploading documents