Multiple Choice
Figure 4-5
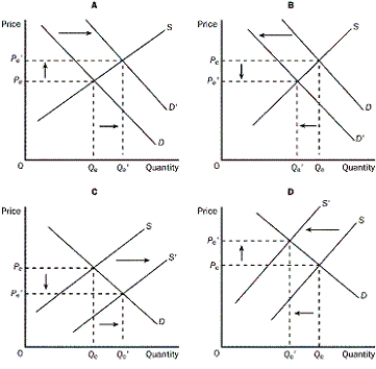
-Refer to the Figure 4-5.Which of the four graphs represents the market for peanut butter after a major hurricane hits the peanut-growing area?
A) graph A
B) graph B
C) graph C
D) graph D
Correct Answer:
Verified
Related Questions
Q41: What will result from a decrease in
Q53: Figure 4-5 Q57: Figure 4-5 Q60: Which of the following would definitely result Q67: What would happen to the equilibrium price Q75: Which of the following would cause both Q173: If a shortage exists in a market, Unlock this Answer For Free Now! View this answer and more for free by performing one of the following actions Scan the QR code to install the App and get 2 free unlocks Unlock quizzes for free by uploading documents
![]()
![]()

