Figure 4-5
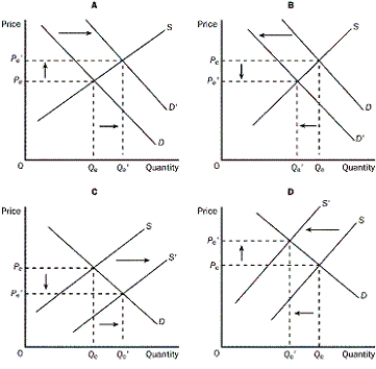
-Refer to the Figure 4-5.Which of the following is shown in Graph A?
A) an increase in demand
B) an increase in quantity demanded
C) an increase in supply
D) a decrease in consumer income
Correct Answer:
Verified
Q41: What will result from a decrease in
Q52: Figure 4-5 Q53: Figure 4-5 Q58: Figure 4-5 Q60: Which of the following would definitely result Q67: What would happen to the equilibrium price Q75: Which of the following would cause both Q173: If a shortage exists in a market, Q196: Figure 4-5 Q197: If the demand for a product increases, Unlock this Answer For Free Now! View this answer and more for free by performing one of the following actions Scan the QR code to install the App and get 2 free unlocks Unlock quizzes for free by uploading documents
![]()
![]()
![]()
![]()

