Multiple Choice
Figure 4-5
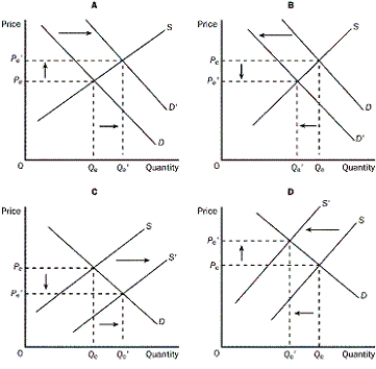
-Refer to the Figure 4-5.Which of the four graphs shown illustrates an increase in quantity supplied?
A) graph A
B) graph B
C) graph C
D) graph D
Correct Answer:
Verified
Related Questions
Q47: What does supply-and-demand analysis involve?
A)comparisons of prices
Q50: Figure 4-5 Q51: Figure 4-5 Q53: Figure 4-5 Q55: Figure 4-5 Q57: Figure 4-5 Q173: If a shortage exists in a market, Q174: What is step one in the three-step Q196: Figure 4-5 Q197: If the demand for a product increases, Unlock this Answer For Free Now! View this answer and more for free by performing one of the following actions Scan the QR code to install the App and get 2 free unlocks Unlock quizzes for free by uploading documents
![]()
![]()
![]()
![]()
![]()
![]()

