Multiple Choice
Figure 4-5
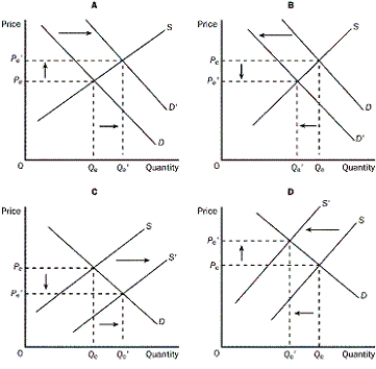
-Refer to the Figure 4-5.Which of the following is shown in Graph C?
A) an increase in demand
B) an increase in quantity demanded
C) an increase in supply
D) an increase in input prices
Correct Answer:
Verified
Related Questions
Q45: What would an early frost in the
Q46: Suppose you wish to analyze the change
Q47: What does supply-and-demand analysis involve?
A)comparisons of prices

