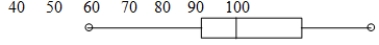
From the box-and-whiskers plot above, give the following:
A) the 25th percentile
B) the range
C) two scores that have about 75% of the scores between them
D) two other scores that have about 75% of the scores between them
Correct Answer:
Verified
B) about...
View Answer
Unlock this answer now
Get Access to more Verified Answers free of charge
Q9: Of the 1000 scores on a test,
Q10: How many of the 800 scores on
Q11: A) Make a box plot for the
Q12: A) Make a box plot for the
Q13: A) Make a box plot for
Q15: Box plots of the heights (in inches)
Q16: Box-and-whiskers plots for a sample of students
Q17: Here is a stem-and-leaf plot for
Q18: A) Give five values that have mean
Q19: The mean is affected more by an
Unlock this Answer For Free Now!
View this answer and more for free by performing one of the following actions

Scan the QR code to install the App and get 2 free unlocks

Unlock quizzes for free by uploading documents