Box plots of the heights (in inches) for a sample of college students are shown below. (Data file adapted from DataScope.) 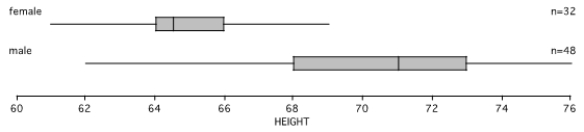
A) What is the height of the shortest female student?
B) How many males are shorter than 68 inches tall?
C) Three-fourths of the females have heights less than _____ inches.
D) What is the upper quartile for heights for male?
E) Give two heights that have about 75% of the females between them.
F) Give two other heights that have about 75% of the females between them and _____.
G) The total graph for males is longer than the total graph for females. Is the reason because there are 48 males and only 32 females in the sample? Explain.
H) How short would a female be if her height were an outlier for the data above?
I) Give the five-number summary for the males.
J) If the data for the two groups were put together, at what percentile would 71 inches be?
Correct Answer:
Verified
B) 12 (25% of 48)
C) 66
D) ...
View Answer
Unlock this answer now
Get Access to more Verified Answers free of charge
Q10: How many of the 800 scores on
Q11: A) Make a box plot for the
Q12: A) Make a box plot for the
Q13: A) Make a box plot for
Unlock this Answer For Free Now!
View this answer and more for free by performing one of the following actions

Scan the QR code to install the App and get 2 free unlocks

Unlock quizzes for free by uploading documents