The following table represents the amount of monthly data handled by MichNet, the University of Michigan's gateway to the Internet, sampled at six month intervals for the years 1993-1995. (The data is from the Michigan Daily, March 30, 1996, p.4.)
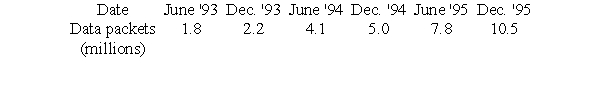
Let d be the number of data packets handled monthly (in billions), and t be time in years since December, 1992. Find equations for the best fit exponential function and the best fit power function that model these data (you do not have to enter your equations). By comparing their correlation coefficients, choose which model gives a better fit.
A) The exponential model
B) The power function model
Correct Answer:
Verified
Q1: The following table represents the amount of
Q3: The following table represents the amount of
Q4: The following table contains the names of
Q5: George measures the force exerted by a
Q6: George measures the force exerted by a
Q7: George measures the force exerted by a
Q8: George measures the force exerted by a
Q9: The number of yearly childbirths for a
Q10: The number of yearly childbirths for a
Q11: The number of yearly childbirths for a
Unlock this Answer For Free Now!
View this answer and more for free by performing one of the following actions

Scan the QR code to install the App and get 2 free unlocks

Unlock quizzes for free by uploading documents