The following table represents the amount of monthly data handled by an Internet server, sampled at six month intervals for the years 1993-1995. 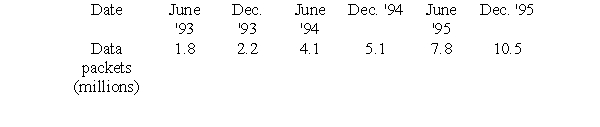
Let d be the number of data packets handled monthly (in billions), and t be time in years since December, 1992. The best exponential model for this data is of the form  , where a = _____ and b = _____. Give both answers to 6 decimal places.
Correct Answer:
Verified
Q2: The following table represents the amount of
Q3: The following table represents the amount of
Q4: The following table contains the names of
Q5: George measures the force exerted by a
Q6: George measures the force exerted by a
Q7: George measures the force exerted by a
Q8: George measures the force exerted by a
Q9: The number of yearly childbirths for a
Q10: The number of yearly childbirths for a
Q11: The number of yearly childbirths for a
Unlock this Answer For Free Now!
View this answer and more for free by performing one of the following actions

Scan the QR code to install the App and get 2 free unlocks

Unlock quizzes for free by uploading documents