Educational psychologists suggest that a child's intellectual capacity, I, can be represented as a function of time, t, in months, as follows: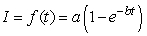 ,Where a > 0, b > 0 are constants. What is the effect on the graph of I of decreasing the value of b?
A) The graph gets closer to the asymptote more quickly.
B) The asymptote moves to the left.
C) The asymptote moves down.
D) The graph gets closer to the asymptote less quickly.
Correct Answer:
Verified
Q2: Let Q3: Let Q4: Let Q5: A cup of coffee is initially at Q6: Below is a graph of the function Q7: Below is a graph of the function Q8: Given the graph of Q9: One of these graphs shows a transformation Q10: The graph of Q11: The first figure is the graph of Unlock this Answer For Free Now! View this answer and more for free by performing one of the following actions Scan the QR code to install the App and get 2 free unlocks Unlock quizzes for free by uploading documents![]()
![]()
![]()
![]()
![]()

