The following tables give the profits (in millions) of a manufacturing company  months after January 1, 2008.
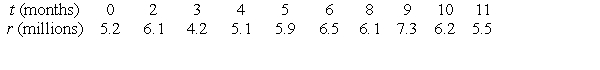 Use a calculator program to find the regression line for this data. What is the physical interpretation of the t-intercept?
Correct Answer:
Verified
View Answer
Unlock this answer now
Get Access to more Verified Answers free of charge
Q10: The following table gives the number P
Q11: The following table shows the size of
Q12: The following table shows the cost of
Q13: The following table gives the profits (in
Q14: The following table gives the profits (in
Unlock this Answer For Free Now!
View this answer and more for free by performing one of the following actions

Scan the QR code to install the App and get 2 free unlocks

Unlock quizzes for free by uploading documents