Short Answer
The following table gives the profits (in millions) of a manufacturing company  months after January 1, 2008.
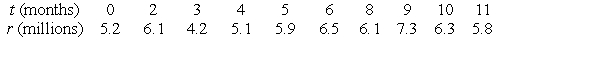 Use a calculator program to find the regression line for this data.
Correct Answer:
Verified
Related Questions
Q15: The following tables give the profits (in
Q16: Does an Q17: Several years ago, the wild rabbits of Q18: The following table gives the number of Q19: The following table shows the cost of![]()

