Short Answer
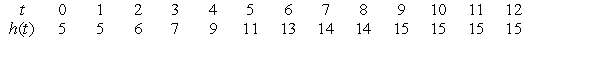
The following table shows the height of a tree (to the nearest foot) as a function of time (in years). What was the average rate of change in the height of the tree between t = 4 and t = 6?
Correct Answer:
Verified
Related Questions
Q83: A wildlife ranger finds that
Q84: It costs a band $600 to pay
Q85: It costs a band $900 to pay
Q86: It costs $13 to operate a lemonade
Q87: It costs $15 to operate a lemonade
Q89: Calculate the average rate of change for
Q90: The following figure shows the graph of
Q91: Is the function graphed in the following
Unlock this Answer For Free Now!
View this answer and more for free by performing one of the following actions

Scan the QR code to install the App and get 2 free unlocks

Unlock quizzes for free by uploading documents