Multiple Choice
The following figure shows the graph of  Estimate
Between x = 10 and x = 15.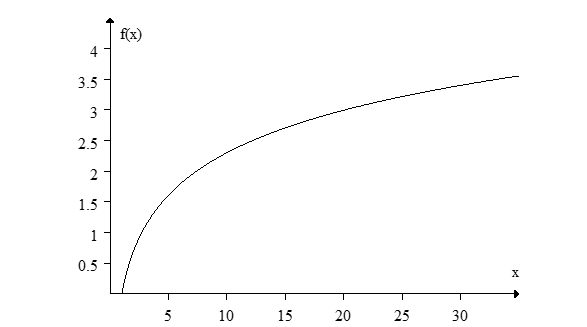
A) 0.08
B) 0.68
C) 1.98
D) -0.08
Correct Answer:
Verified
Related Questions
The following figure shows the graph of Estimate
Between x = 10 and x = 15.
A) 0.08
B) 0.68
C) 1.98
D) -0.08
Correct Answer:
Verified

