The table below shows tobacco production in the United States for the years 1991-1996.
U.S. Tobacco Production: 1991-96
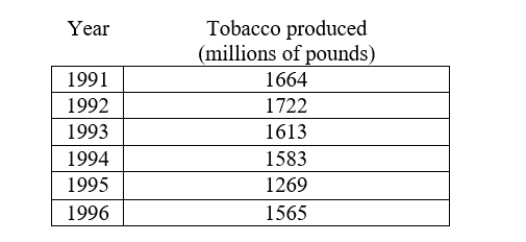
A) Find the total change in tobacco production (in millions of pounds) from 1993 to 1995.
B) Determine by how many millions of pounds tobacco production has changed on average each year from 1993 to 1995.
Correct Answer:
Verified
Q1: The table below gives the life expectancy
Q2: The table below gives population figures for
Q4: The table shows the number of manatees
Q5: A house valued at $65,000 in 1988
Q6: If a is measured in miles, b
Q7: The following table shows the number of
Q8: The following table shows the number of
Q9: The number of students enrolled in higher
Q10: The number of students enrolled in higher
Q11: The table below is a data set
Unlock this Answer For Free Now!
View this answer and more for free by performing one of the following actions

Scan the QR code to install the App and get 2 free unlocks

Unlock quizzes for free by uploading documents