The following table shows the number of new AIDS cases reported in Florida from 1986 to 1994.
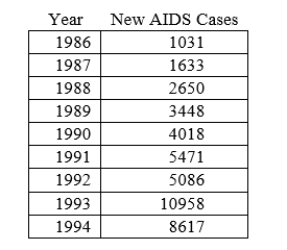
Calculate the average annual rate of change of new AIDS cases per year from 1988 to 1993.
Round your answer to 2 decimal places.
Correct Answer:
Verified
Q2: The table below gives population figures for
Q3: The table below shows tobacco production in
Q4: The table shows the number of manatees
Q5: A house valued at $65,000 in 1988
Q6: If a is measured in miles, b
Q8: The following table shows the number of
Q9: The number of students enrolled in higher
Q10: The number of students enrolled in higher
Q11: The table below is a data set
Q12: The table below is a data set
Unlock this Answer For Free Now!
View this answer and more for free by performing one of the following actions

Scan the QR code to install the App and get 2 free unlocks

Unlock quizzes for free by uploading documents