Multiple Choice
Use the figure below to answer the following question(s) .
Figure 4-7
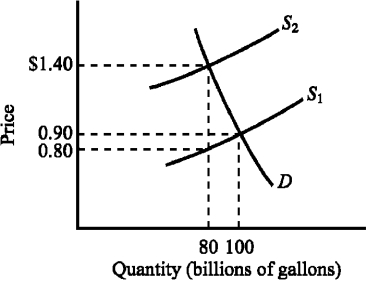
-Refer to Figure 4-7.The supply curve S₁ and the demand curve D indicate initial conditions in the market for gasoline.A $.60-per-gallon excise tax on gasoline is levied.How much revenue does the $.60-per-gallon tax generate for the government?
A) $40 billion
B) $48 billion
C) $50 billion
D) $60 billion
Correct Answer:
Verified
Related Questions

