Use the figure below to answer the following question(s) .
Figure 4-8
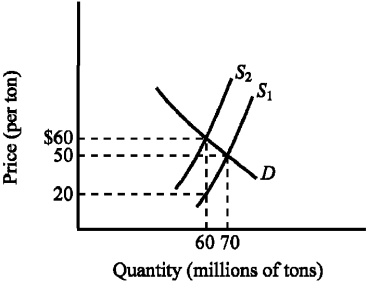
-Refer to Figure 4-8.The supply curve S₁ and the demand curve D indicate initial conditions in the market for soft coal.A $40-per-ton tax on soft coal is levied,shifting the supply curve from S₁ to S₂.Imposing the tax increases the equilibrium price of soft coal from
A) $20 to $60 per ton.
B) $20 to $50 per ton.
C) $50 to $60 per ton.
D) $50 to $90 per ton.
Correct Answer:
Verified
Q5: Figure 4-2 Q7: Figure 4-1 Q22: Figure 4-3 Q115: When a government subsidy is granted to Q121: Suppose that the federal government grants a Q126: If the supply of health care services Q136: A subsidy on a product will generate Q200: If a $50 subsidy is legally (statutorily) Q204: Use the figure below to answer the Q205: Use the figure below to answer the Unlock this Answer For Free Now! View this answer and more for free by performing one of the following actions Scan the QR code to install the App and get 2 free unlocks Unlock quizzes for free by uploading documents![]()
![]()
![]()

