Multiple Choice
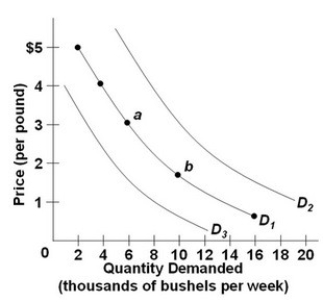 Refer to the above diagram, which shows three demand curves for coffee. Which would cause the change in the quantity of coffee demanded illustrated by the shift from point a to point b?
A) A decrease in the price of coffee
B) An increase in consumer incomes
C) A decrease in the price of sugar
D) An increase in the price of tea
Correct Answer:
Verified
Related Questions

